By Thomas Ultican 11/11/2026
Total enrollment in California’s taxpayer funded schools has dropped from 6,226,737 students in 2015 to 5,731,260 in 2025. While the state’s 2025 total population has grown to 39,529,000 from 38,700,000 in 2015, new born babies have gone from 491,748 in 2015 to 393,222 in 2025. A probable reason for these contradictory data sets is that the median age in the state has grown by 2.5 years over these ten years and younger people are less inclined to have children. Even though this has put a strain on schools, graduation rates are surprisingly high.
Last week, San Diego Union education reporter, Kristen Taketa, wrote about how this is playing out in San Diego County. She noted that 88% of the county’s publicly supported high school students graduated in 2026. That was an increase of about 6% from the year before the COVID-19 pandemic and all but four county school districts graduated more than 90% of their seniors.
Taketa observed, “Charter high schools fared worse than district schools — only 73% of charter school students in the county graduated within four years, compared with 92% of district students.”
She also cited USC education professor Morgan Polikoff’s observation that graduation rates are the easiest accountability measure to manipulate.
Polikoff is a technocrat who promotes growth models which are often fueled by bad data, are opaque and force accepting the views of mathematics experts like himself. Polikoff has shared, “I’m on the board of the Data Quality Campaign and I’ve written extensively (and favorably) about the role of accountability in promoting educational improvement.”
Many educators and academics believe test-based accountability favored by the Data Quality Campaign is misguided and especially harmful to schools and students in poorer districts.
Suspicious Graduation Rates
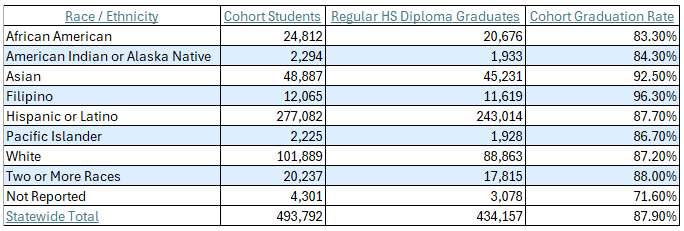
California High School Graduation Rates 2025
America’s high school graduation rates peaked at about 77% in 1970 and then drifted down for almost four decades to 69% in 2007. Then online credit recovery arrived and rates started zooming up. In 2016, over 83% of California’s freshman cohort graduated on time and in 2012, 81% of the freshman cohort in America graduated on time. In 2017, I wrote about the credit recovery scam. This leads me to reluctantly agree with Professor Polikoff’s observation that graduation rates are easily manipulated and are not a solid accountability metric.
I am personally not disturbed by the idea that a significant number of students did not honestly meet their district’s graduation requirements, but I do think there needs to be more transparency and a rethinking of what those requirements should be.
San Diego Unified, which reported a 94% graduation rate, like most other districts leaned heavily on credit recovery to improve graduation rates.
Credit recovery students are able to gain graduation credits in as short a time as one day. According to several teacher friends who have taught teacher led credit recovery, there is no real instruction, just filling in packets (“seats and sheets”). I have heard many students say, “I don’t care if I fail, I’ll do credit recovery.” Why not? It’s easier.
Professor Adam Tyner wrote “Is Credit Recovery as Bad as the Say?” He Stated:
“Since in-person proctoring of these exams is rare, what’s even worse is that 91 percent of the assessment questions could be easily answered with a simple Google search. Many of these questions have been floating around the internet since 2015, with answers readily available on numerous websites. The process for retaking tests previously failed is also alarmingly lenient. Students retaking unit exams, known as “post-tests,” can review all their previous answers along with the correct ones before attempting the exam again, often with the questions in the exact same order. This method maximizes the student’s likelihood of passing the exam without actually understanding the material, further diminishing the credibility of these assessments.”
Academic Performance
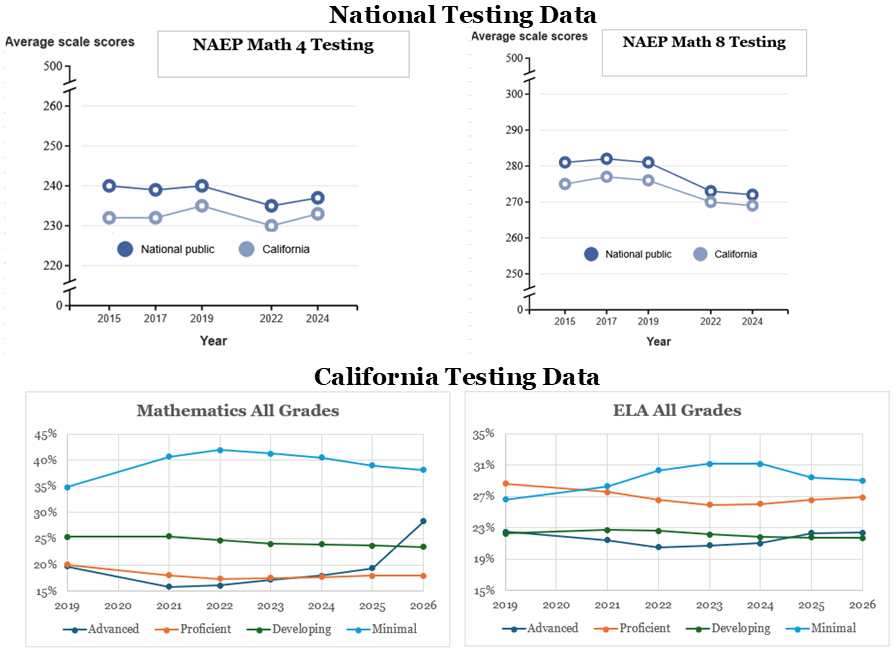
Testing Data Graphs from National and California Testing
The top two graphs above are of math testing data from the National Assessment of Education Progress (NAEP) testing and the bottom graphs are of state of California yearly testing. Both data sets have no data from the 2020-2021 school year. The California data is aggregated for students in all school years and the National data is for two specific grades, 4th and 8th. The 2026 national data is yet to be released but in California the 2026 data is available.
For California high school students, the descriptors Advanced, Proficient, Developing and Minimal have specific student requirements attached. For example, student scoring Advanced in math are not required to take a fourth year of math. Otherwise, these descriptors are indicative of student scoring in specific data ranges.
These graphs and several more that I perused indicate that most students quickly came back on course with the exception of the lowest scoring students. While the advanced group appears to have made a complete recovery, the other three groups have come close but have yet to make a full recovery. However, it should be pointed out these differences are small enough that they may be misleading.
Taketa’s article noted that last year UC San Diego faculty claimed 8.5% of incoming freshmen were assigned remedial math courses a jump up from 0.5% five years prior. This may have been a result of being out of the classroom for one year just three years prior to matriculation.
On the national level, it seems that the students in California and the students nationwide are performing in a similar vain. Although California has excellent schools, its unusually large immigrant population (English language learners) depresses NAEP scoring below the national average.
Public School Privatization
The billionaire financed school privatization movement is advancing in California especially in the southern end of the state. There is almost no school voucher presence in the state but charter schools keep gaining a bigger percentage of students. While the state’s enrollment is shrinking, charter school enrollment keeps inching up. In the 2025-2026 school year, charter schools enrolled 727,870 California students coming to 12.7% if total taxpayer funded enrollment.
The state’s two largest county populations account for a significant amount of the charter school student population. Los Angeles County’s charter enrollment actually dropped by 4,096 students in 2026 but the percentage of county students in charter schools rose by 0.1% to 16.3%. San Diego County, which has the state’s second largest population, saw the percentage of charter school students in the county zoom to 19.2% of all publicly financed students. San Diego added 2,590 charter school students in 2026 with total enrollment climbing to 90,806 students.
Four of the five largest county populations in California enroll more than half of the state’s charter school students; Los Angeles County, San Diego County, Riverside County and San Bernadino County. Interestingly, the state’s third largest county population resides in Orange County which is sandwiched between Los Angeles and San Diego counties but has about a third of San Diego County’s charter penetration at 6.7% of taxpayer funded students.
Conclusion
The data tells a story of decent performance through the pandemic era by California’s public schools. The academic data has mostly maintained but unfortunately, so has the privatization agenda. Having 12.7% of students in state funded privatized schools is not good. Be clear, that is just the taxpayer supported private schools and does not count the students whose parents pay out of their own pocket for their children to attend private schools.
All in all, California public education deserves high marks for how well it navigated the pandemic era. In a time of aging demographics, that is reducing student numbers and billionaire money working against public schools, districts have managed the shrinking reality well and continued providing quality outcomes.



Leave a Reply