
By Thomas Ultican 2/4/2025
Billed as the Nations Report Card, the National Assessment of Education Progress (NAEP) just released data from the 2024 testing window. The first NAEP assessments occurred in 1969 and in 1996 school testing in all states became mandatory every two years. Almost since the beginning, the testing results have been treated as a crisis moment. This year, both math and reading data came in lower than pre-pandemic levels. To the reform group, Education Trust, this is a time for action but it seems more likely that less action might be in order. The last two decades of education reform have been a harmful disaster. So prudence in our response is a better course.
The problem with all this data is summed up nicely by Peter Greene:
“As long time readers know …, I’m not one to get excited about scores on the Big Standardized Test, despite the claims that it will tell us How Schools Are Doing. There are lots of reasons to suspect that America’s Gold Standard of Testing is not all the gold standardy. And there is one serious lesson to be learned, which is that having all this cold hard data doesn’t actually change a damned thing— everyone just “interprets” it to support whatever it is they wanted to do anyway.
Plots of the average testing results covering math and reading for the past 32-years do not inspire much insight even if you believe in standardized testing.
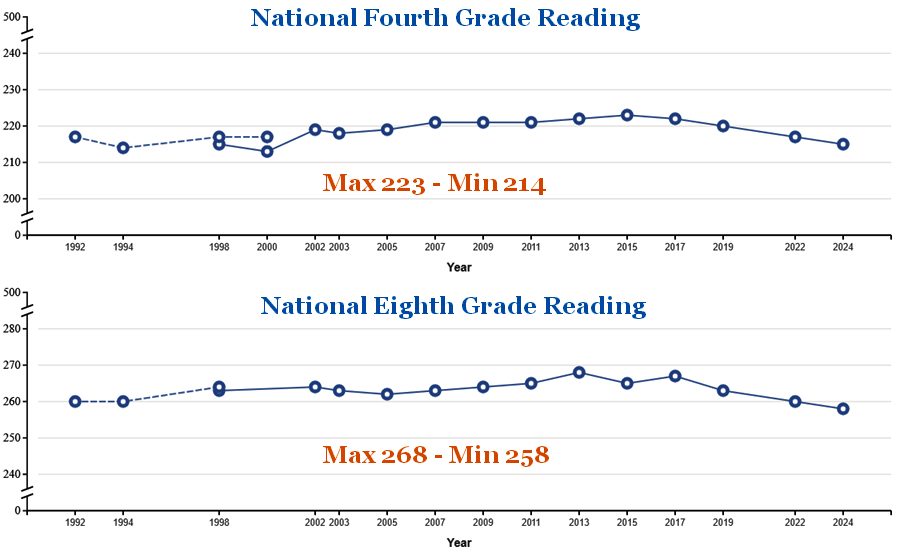
The plots above were created from NAEP Data. Since 1992, both sets, which are plotted on a 500 point scale, wiggled up and down within a 10 point range.
In 2020, COVID-19 happened and this year’s 4th graders joined in-school classes a year or more late. The 8th graders missed at least their 5th grade in-school classes and some of them missed significantly more. During that year or more out of school, a tendency for truancy developed. So it is not surprising that their testing scores are not stellar, but they are still within the 10-point historical range.
Reading Scores Down
Peggy Carr, Commissioner of the National Center for Education Statistics (NCES) said, “Student achievement has not returned to pre-pandemic levels, reading scores continue to decline, and our lowest performing students are reading at historically low levels.”
For the past decade, there has been a major dispute over how to teach reading in the United States. Dozens of states have overhauled their reading instruction to adopt so called science of reading (SoR) methods. These changes came about largely due to a well financed corporate driven campaign that has drowned out literary experts.
NAEP created charts based on reading data disaggregated by scoring percentiles are shown below.
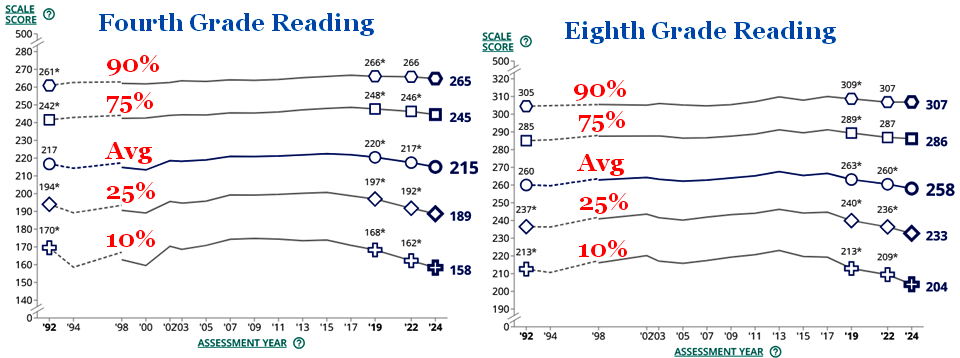
In both the 4th grade and 8th grade charts reading scores started declining about 2015 and have fallen every testing window since. At about the same time, balanced literacy, which was the nation’s most popular method for teaching reading, started being replaced by SoR. The correlation between SoR and the dip in reading scores is obvious but may be misleading. Chalkbeat reports, “And while federal education officials are usually reticent to explain what caused a particular increase or decrease in scores, Carr cautioned that the near-universal dips in reading should not be taken as evidence that reading reforms have not worked.”
I have believed for some time that SoR is less about good teaching and more about profits, so it is tempting to discount Dr. Carr’s warning. Standardized testing has serious limitations and it would be hypocritical to discount it only when I did not like the results and then hale the outcomes that I liked.
However, the NAEP data since 2017 certainly provides NO support for SoR.
Math Staying Steady
The 2024 math results for fourth-grade improve by 3% over 2022 but were still 2% lower than the pre-pandemic 2019 testing. Eighth-graders treaded water in 2024 with scores that were not significantly different from 2022 and were 8% lower than 2019.
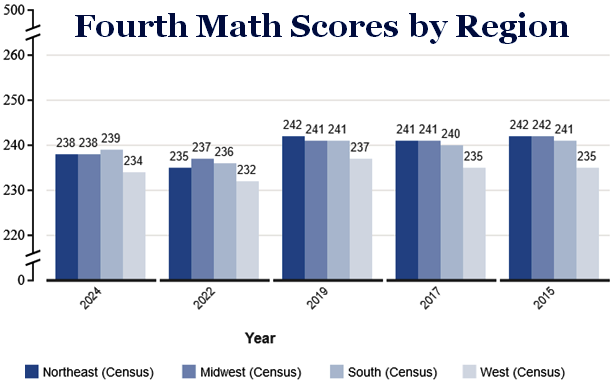
NAEP allows researchers to break down scores by region. I created this bar graph of fourth grade math for the last five testing windows. The South, Midwest and Northeast had almost identical scores while the west lagged by 4-6 percent. Would we all like to see better scores? of course. On the other hand, there is nothing here that looks dire. In 2022, there was a small drop in scores and in 2024 about half of the drop was overcome.
Absenteeism is probably holding back score recovery in both math and reading. It is generally considered that when a student misses more than 10% of the school year they are chronically absent. National Public Radio (NPR) has reported, the rates of chronic absenteeism doubled during the pandemic. NAEP also asked students, during this last testing cycle, how many days they had missed in the previous month. NPR notes that, “Across the board, lower-performing students were more likely to report missing five or more days of school in the previous month, compared with higher-performing students.”
Some Final Observations
In 2007, NCES performed a study on what happened to the 1992 NAEP participants. They were interested in how the four attainment level, Below Basic, Basic, Proficient and Advanced, matched student outcomes.
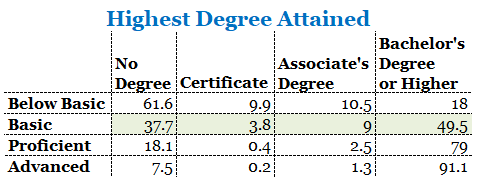
The key results are shown in the table above. It looks like the levels have misleading names. Half of the students in the Basic group achieved a bachelor’s degree or higher. This means that they were college ready and academically proficient. The NAEP labels are aligned too high; therefore misleading.
In 2019, Diane Ravitch commented on that year’s NAEP data: “After a generation of disruptive reforms—No Child Left Behind and Race to the Top, VAM and Common Core—after a decade or more of disinvestment in education, after years of bashing and demoralizing teachers, the National Assessment of Educational Progress (NAEP) for 2019 shows the results:
‘“Over the past decade, there has been no progress in either mathematics or reading performance, and the lowest-performing students are doing worse,”’ said Peggy Carr, the associate commissioner of the National Center for Education Statistics, which administers the NAEP. ‘“In fact, over the long term in reading, the lowest-performing students—those readers who struggle the most—have made no progress from the first NAEP administration almost 30 years ago.”’
SoR became the billionaire reform de jure in 2019. No Child Left Behind, Race to the Top, VAM and Common Core had come to be seen as either failures or frauds. Profiteers hoped the new SoR strategy would lead to privatizing and controlling all aspects of education and they made great efforts to promote it. Will the 2024 NAEP results be the beginning of the end for their greedy dreams?
Whatever the case, Ravitch’s 2019 NAEP analysis still holds true. The 2024 NAEP results are nothing to celebrate but certainly are not a crisis. After all, they are based on standardized testing that is not capable of measuring learning or teaching. Family wealth is about the only thing to which NAEP data correlates.


Recent Comments