By Thomas Ultican 1/13/2025
The latest round of international testing showed that US math scores fell between the 2019 assessment and the 2023 exam. Every four years the US participates in the Trends in International Mathematics and Science Study (TIMSS). In the 2023 cycle, fourth grade math fell by 18 points and eighth grade math fell by 27. An ABC News headline states, “US students’ declining math scores are ‘sobering,’ expert says’” and the New York Times claims, “U.S. Students Posted Dire Math Declines on an International Test.” The reality is that these results are not wonderful but they are neither “sobering” nor “dire.”
It seems that every year there is a new data dump from a large scale assessment (LSA). Regular updates arrive from the National Assessment of Education Progress (NEAP) or the Progress in International Reading Literacy Study (PIRLS) or the testing sponsored by the international banking community, Programme for International Student Assessment (PISA). This winter the TIMSS data was released.
TIMMS and PIRLS
In 1958, a group of scholars, educational psychologists, sociologists, and psychometricians met at the UNESCO Institute for Education (UIE) in Hamburg, Germany, to confer about school effectiveness and student learning. In 1967, these early discussions led to the legal creation of the International Association for the Evaluation of Educational Achievement (IEA) headquartered in Amsterdam with a major data processing and research center in Hamburg. The every four years TIMSS assessment of math and science plus the every five years PIRLS assessment of reading are two of IEA’s major ongoing efforts.
The first IEA study began in 1959 and the completed report was published in 1962. In the forward, it stated:
“If the results so far, … are little more than suggestive, at least they offer real encouragement for believing that such researches can, in the future, lead to more significant results and begin to supply what Anderson has lamented as ‘the major missing link in comparative education’, which in his view is crippled especially by the scarcity of information about the outcomes or products of educational systems.” (Emphasis Added)
“Certainly the international group itself was sufficiently encouraged by the results of its first exploratory study to embark on a more ambitious one during which, at several key points in the secondary school cycle, as comparable samples of schoolchildren as can be obtained will be subjected to tests which bear close reference to curricula and educational aims in all the participating countries.” (Emphasis Added)
From their statements, it is clear that mathematically adept researchers saw testing as a valid way to study teaching and learning. The problem is they did not properly understand the tremendous influence of error in education testing. Family situations have extraordinarily greater influence on outcomes than either schools or teachers. These errors are so great that they obscure testing results.
The reporting on this first study was quite crude. Their use of standard deviations to communicate the results was difficult for non-experts to follow and their graphics were not well designed. These graphics came without legends and were therefore indecipherable but one graphic on page 29 did give a sense of comparison.
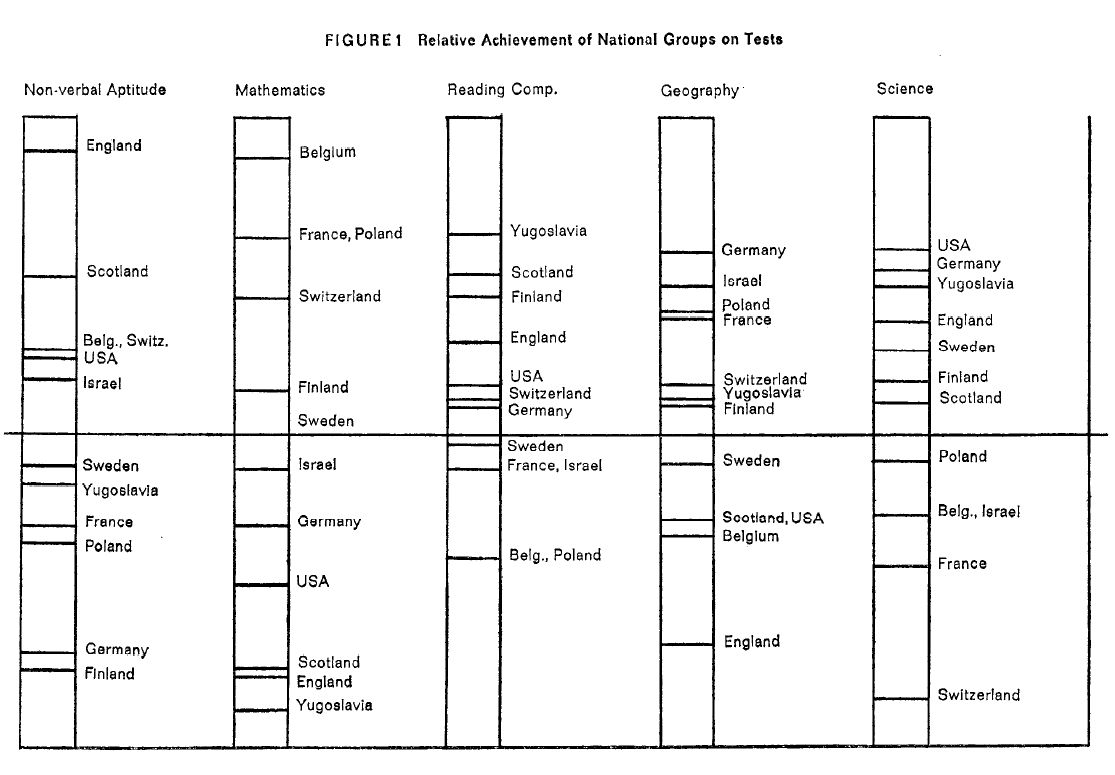
Looking at this graphic we can see that in 1959, the USA was pretty good in “Non-verbal Aptitude” whatever that is. It was relatively poor in math, OK in reading, weak in geography and super in science. This trend of the US being mostly average on international standardized assessments has persisted until today.
New Data from TIMSS
Forty-seven countries participated in the 2023 TIMSS 4th grade math study. Many of the countries studied were quite small with only Japan and the United States having populations of more than 100 million people. Using the World Population Review, I added population data to the TIMSS data and have put it into the following table for the 10 most populous countries assessed.
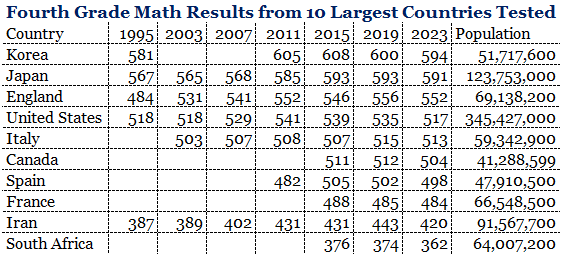
The table is organized in order of their average 2023 assessment results. Even though the US had an 18 point drop between 2019 and 2023, it still ranked fourth among the larger countries. The US had the second largest drop, but all of the large countries also had scoring decreases. The table reveals that the US has a population almost three times the next largest country and the top two scoring countries have homoginous student populations with little diversity.
The National Center for Education Statistics (NCES) receives an expanded data set that they use to make many presentations of the outcomes. In a revealing set, NCES shows the effect of poverty on the US data with the following table which is reformatted.
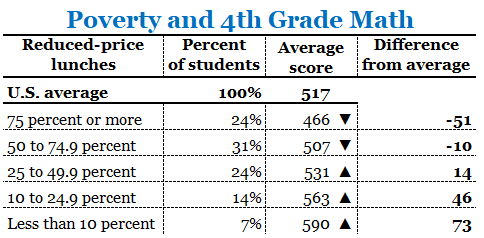
This table strongly suggests that the US decrease in scores was concentrated in the 24% of students among the group with 75% free and reduced price lunches, which is believed to be a good proxy for poverty. There are many reasons to think this group was more profoundly affected by the pandemic than other students. They were less likely to participate in virtual school, were living with people in high risk of contracting the disease and were more likely to be absent once schools opened.
LSA Reliability
Recently a British group, Assessment and Quality Insights, noticed that the PISA and TIMSS testing data showed opposite trends for British math, science and reading. TIMSS tests 12 year olds while PISA tests 15 year olds, but it is remarkable that the two assessments came up with opposite trends. Since 2012, PISA has reported falling scores in the three disciplines while TIMSS has shown rising scores.
In 2020, Jake Anders et al, published “Is Canada really an education superpower? The impact of non-participation on results from PISA 2015.” They stated:
“In this paper, we consider whether this is the case for Canada, a country widely recognised as high performing in the Programme for International Student Assessment (PISA). Our analysis illustrates how the PISA 2015 sample for Canada only covers around half of the 15-year-old population, compared to over 90% in countries like Finland, Estonia, Japan and South Korea.“
This highlights a common problem with comparing international test scores. It is not clear who the student are that are being tested and if countries are juking the scores for political purposes.
Another problem with LSAs is highlighted by a paper from the University of Kansas, “Side Effects of Large-Scale Assessments in Education.” They note that LSAs distort the purpose of education by misleading the public into believing these assessments reflect the quality of teaching. Also curriculums get narrowed when only core subjects of math and reading are assessed. Plus the assessments cause many educators to “teach to the test” and exam induced suicides are reported in “China, Hong Kong China, Taiwan China, Korea, Singapore, Cambodia, Vietnam, and Japan (Cui, Cheng, Xu, Chen, & Wang, 2011).” (Page 9)
LSAs also bring moral corruption to education. According to psychologist Donald Campbell’s law, “The more any quantitative social indicator is used for social decision making, the more subject it will be to corruption pressures and the more apt it will be to distort and corrupt the social processes it is intended to monitor.” LSAs are not above this law. (Page 9)
Conclusion
LSAs are very expensive and more liable to mislead than enlighten. A lot of testing companies are making money, but education is not being well served. I have the same puzzlement as Professor Yong Zhao, who wrote, “It doesn’t make sense: Why Is the US Still Taking the PISA?” His arguments against PISA make a strong case against continuing with TIMSS and PIRLS as well.
To me this testing malarkey is how Corporations like Pearson get their hands on American taxpayer dollars and the taxpayers get worse than nothing for their spending.
Scrap all this international testing nonsense.


Recent Comments